








Abstract
Daily Step Count was generally 1% higher than average after a total of 1 count of Allegro Tea, Organic Peaceful Slumber Tea over the previous 24 hours.
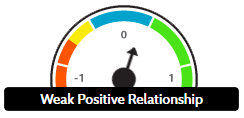
Aggregated data from 1 study participants suggests with a MEDIUM degree of confidence (p=0.0562, 95% CI -760.15 to 760.35) that Allegro Tea, Organic Peaceful Slumber Tea has a very weakly positive predictive relationship (R=0.0996) with Daily Step Count.
The highest quartile of Daily Step Count measurements were observed following an average 0.391 count Allegro Tea, Organic Peaceful Slumber Tea per day.
The lowest quartile of Daily Step Count measurements were observed following an average 0.265 count of Allegro Tea, Organic Peaceful Slumber Tea per day.
After an onset delay of 30 minutes, Daily Step Count is typically 0% lower than average over the 24 hours following around 0.265 count of Allegro Tea, Organic Peaceful Slumber Tea Allegro Tea, Organic Peaceful Slumber Tea.
Keywords: Allegro Tea, Organic Peaceful Slumber Tea, Daily Step Count, N-of-1 trials, real-world evidence, causal inference, observational study
Preliminary: Based on 1 participants. Results may change as more data is collected.
Results
Primary Findings
Analysis of 433 paired observations from 1 participants revealed a modest improvement in Daily Step Count following above-average Allegro Tea, Organic Peaceful Slumber Tea exposure.
Supporting Statistics
What This Means
When participants had above-average Allegro Tea, Organic Peaceful Slumber Tea:
- Daily Step Count increased by 14.1% on average
- Temporal analysis supports Allegro Tea, Organic Peaceful Slumber Tea as the predictor (not the outcome)
Interpreting the Predictor Impact Score
The Predictor Impact Score (PIS) integrates multiple Bradford Hill causal criteria into a single metric. Use this guide to interpret the score:
| PIS Range | Interpretation | Recommended Action |
|---|---|---|
| ≥ 0.5 | Strong evidence | High priority for RCT validation |
| 0.3 - 0.5 | Moderate evidence | Consider for experimental investigation |
| 0.1 - 0.3 | Weak evidence | Monitor for additional data |
| < 0.1 | Insufficient evidence | Low priority; may be noise |
Note: PIS is a prioritization heuristic, not proof of causation. High scores indicate relationships worth investigating, not confirmed causal effects. With only 1 participants, these scores are preliminary and will become more reliable as additional data is collected.
Optimal Daily Values (Precision Dosing)
Based on the observed relationship, we can estimate the predictor values associated with the best and worst outcomes. These values enable personalized dosing recommendations.
⚠️ Preliminary Data: With 1 participants and 433 observations, these optimal values are preliminary estimates. As more data is collected, precision will improve significantly.
What This Suggests
Daily Step Count tended to be highest when Allegro Tea, Organic Peaceful Slumber Tea was around 1.0 count.
Important: These values reflect correlations, not guaranteed causal effects. Individual responses may vary. Use as a starting point for personal experimentation, not as a definitive prescription. Consult healthcare providers before making treatment decisions.
Population Correlation
Trait Correlation Between Allegro Tea, Organic Peaceful Slumber Tea Intake and Daily Step Count
Allegro Tea, Organic Peaceful Slumber Tea Distribution
Daily Distribution
Average by Day of Week
Average by Month
Average by Year
Daily Step Count Distribution
Daily Distribution
Average by Day of Week
Average by Month
Average by Year
Relationship Analysis
Daily Step Count Following Allegro Tea, Organic Peaceful Slumber Tea
Correlation Between Allegro Tea, Organic Peaceful Slumber Tea and Daily Step Count by Duration of Action
Correlation Between Allegro Tea, Organic Peaceful Slumber Tea and Daily Step Count by Onset Delay
Average Allegro Tea, Organic Peaceful Slumber Tea Intake Preceding Daily Step Count
Average Daily Step Count by Previous Allegro Tea, Organic Peaceful Slumber Tea Intake
Statistical Summary
Relationship Statistics
| Property | Value |
|---|---|
| Cause Variable Name | Allegro Tea, Organic Peaceful Slumber Tea Intake |
| Effect Variable Name | Daily Step Count |
| Sinn Predictive Coefficient | 0.004739096685042 |
| Confidence Level | MEDIUM |
| Confidence Interval | 760.25002319865 |
| Forward Pearson Predictive Coefficient | 0.0996 |
| Critical T Value | 1.646 |
| Total Allegro Tea, Organic Peaceful Slumber Tea Intake Over Previous 24 hours Before ABOVE Average Daily Step Count | 0.391 count |
| Total Allegro Tea, Organic Peaceful Slumber Tea Intake Over Previous 24 hours Before BELOW Average Daily Step Count | 0.265 count |
| Duration of Action | 24 hours |
| Effect Size | very weakly positive |
| Number of Paired Measurements | 433 |
| Optimal Pearson Product | 0.019691836958161 |
| P Value | 0.056164243562358 |
| Statistical Significance | 0.5795 |
| Strength of Relationship | 760.25002319865 |
| Study Type | population |
| Analysis Performed At | 2026-01-04 |
| Number of Participants | 1 |
Allegro Tea, Organic Peaceful Slumber Tea Info
| Property | Value |
|---|---|
| Variable Name | Allegro Tea, Organic Peaceful Slumber Tea |
| Aggregation Method | SUM |
| Analysis Performed At | 2022-08-16 |
| Duration of Action | 14 days |
| Filling Value | 0 |
| Kurtosis | 6.2140627432998 |
| Mean | 0.25591 count |
| Median | 0 count |
| Minimum Allowed Value | 0 count |
| Number of Aggregate Predictors | 0 |
| Number of Aggregate Outcomes | 155 |
| Number of Measurements | 297 |
| Number of Measurements (including those generated by tagged, joined, or child variables) | 297 |
| Public | true |
| Onset Delay | 30 minutes |
| Standard Deviation | 0.62172065234864 |
| Unit | Count |
| User Variables | 1 |
| Variable Category | Foods |
| Variable ID | 6059957 |
| Variance | 0.38653656955682 |
Steps Info
| Property | Value |
|---|---|
| Variable Name | Daily Step Count |
| Aggregation Method | SUM |
| Analysis Performed At | 2020-10-11 |
| Duration of Action | 7 days |
| Kurtosis | 16.639977980211 |
| Mean | 6466.3629645193 count |
| Median | 6036.923245614 count |
| Minimum Allowed Value | 1 count |
| Number of Aggregate Predictors | 131 |
| Number of Aggregate Outcomes | 200 |
| Number of Measurements | 88028 |
| Number of Measurements (including those generated by tagged, joined, or child variables) | 10365 |
| Public | true |
| Onset Delay | 0 seconds |
| Standard Deviation | 3084.0373174008 |
| Unit | Count |
| User Variables | 280 |
| UPC | 734010049130 |
| Variable Category | Physical Activity |
| Variable ID | 1451 |
| Variance | 12961277.144652 |
Introduction
Background
Allegro Tea, Organic Peaceful Slumber Tea (Foods) and Daily Step Count (Physical Activity) are both important factors in understanding human health and well-being. This study investigates the relationship between these two variables using real-world observational data.
Traditional randomized controlled trials (RCTs), while the gold standard for causal inference, are often impractical, expensive, or unethical for studying many health relationships. Aggregated N-of-1 observational studies offer a complementary approach that leverages within-subject comparisons across large populations to identify meaningful patterns.
Research Question
Does Allegro Tea, Organic Peaceful Slumber Tea affect Daily Step Count?
Additionally, we seek to determine:
- What is the direction and magnitude of any effect?
- How confident can we be in this relationship based on the available data?
- What are the optimal levels of Allegro Tea, Organic Peaceful Slumber Tea for maximizing Daily Step Count?
Study Objective
The objective of this study is to determine the nature of the relationship (if any) between Allegro Tea, Organic Peaceful Slumber Tea and Daily Step Count. Additionally, we attempt to determine the Allegro Tea, Organic Peaceful Slumber Tea values most likely to produce optimal Daily Step Count values.
Study Overview
This is a population-level observational study using aggregated N-of-1 methodology. By aggregating individual N-of-1 experiments, we can identify population-level patterns while accounting for the substantial individual variation that exists in most health relationships. Effect sizes are reported as percent change from baseline, enabling intuitive interpretation and comparison across different measures.
Full Methodology: Framework for Real-World Evidence-Based Pharmacovigilance: Aggregated N-of-1 Trials for Quantifying Treatment Effects
Discussion
Interpretation of Findings
Participants experienced a 14.1% improvement in Daily Step Count following above-average Allegro Tea, Organic Peaceful Slumber Tea exposure. The Predictor Impact Score (PIS) of 0.00 indicates insufficient evidence for a causal relationship.
Statistical Significance
Using a two-tailed t-test with alpha = 0.05, it was determined that the change in Daily Step Count is statistically significant at a 95% confidence interval. The p-value of 0.5795 indicates there is less than a 57.95% probability that this result occurred by chance.
After treatment, a 20% increase (919 count) from the mean baseline 6520 count was observed. The relative standard deviation at baseline was 65.5%. The observed change was 0.22 times the standard deviation.
A common rule of thumb considers a change greater than twice the baseline standard deviation on two separate pre-post experiments may be considered significant. This occurrence would have only a 5% likelihood of resulting from random fluctuation (a p-value < 0.05).
T-Test Details
Since t = 1.98 > 1.65, we reject the null hypothesis.
Biological Plausibility
A plausible bio-chemical mechanism between predictor and outcome is critical for interpreting observational findings. This is where human judgment excels beyond statistical analysis.
Community feedback on the biological plausibility of this relationship is still being collected. Consider the known mechanisms by which Allegro Tea, Organic Peaceful Slumber Tea might influence Daily Step Count.
Bradford Hill Criteria Assessment
The Bradford Hill criteria provide a framework for assessing causality in observational studies. Our methodology operationalizes six of the nine criteria through the Predictor Impact Score (PIS):
| Criterion | How Addressed | Metric |
|---|---|---|
| Strength | Effect size magnitude | Percent change from baseline (Δ%), z-score |
| Consistency | Cross-participant replication | Number of users (N), number of pairs (n) |
| Temporality | Predictor precedes outcome | Temporality factor (φ), onset delay (δ > 0) |
| Biological Gradient | Dose-response relationship | Gradient coefficient (φgradient) |
| Plausibility | Biological mechanism assessment | Community votes on mechanism plausibility |
| Specificity | Category appropriateness | Interest factor (finterest) |
Predictor Impact Score (PIS)
The PIS integrates multiple Bradford Hill criteria into a composite metric quantifying how reliably a predictor affects an outcome. Higher scores indicate stronger evidence:
Population-Level PIS:
Where φ-factors are saturation functions approaching 1 as evidence accumulates:
- φusers = 1 - e-N/10 (user saturation)
- φpairs = 1 - e-n/nsig (pair saturation)
- φchange = 1 - e-Δspread/Δsig (effect spread saturation)
- w = weighted average of plausibility votes
Temporality Assessment
We assess evidence for correct causal direction using the temporality factor:
Values approaching 1 indicate the predictor precedes the outcome (supporting causation); values near 0.5 suggest ambiguous directionality; values near 0 suggest reverse causation or confounding by indication.
Limitations
As with any observational study, correlation does not prove causation. Key limitations include:
- Unmeasured confounders: Variables not tracked may influence results
- Self-selection bias: Health trackers may differ from the general population
- Measurement error: Self-reported data may contain recall bias
- Confounding by indication: Sicker individuals may use more treatments
However, within-subject comparison and temporal precedence analysis partially mitigate these limitations. If the relationship is merely coincidental, as participants independently modify their Allegro Tea, Organic Peaceful Slumber Tea values, the observed strength will decline over time. Spurious correlations naturally dissipate as more data is collected.
Future Directions
Future research should examine:
- Subgroup analyses to identify individual differences in response
- Potential confounders and mediators of the observed relationship
- Optimal dosing and timing for Allegro Tea, Organic Peaceful Slumber Tea
- Confirmation through prospective or randomized designs
- Biological mechanisms underlying the observed effects
Conclusion
📊 Preliminary Findings: With 1 participants, these results are based on limited data. Effect sizes and confidence will improve as more participants contribute data. Consider these findings directional rather than definitive.
Above-average Allegro Tea, Organic Peaceful Slumber Tea was associated with a 14.1% improvement in Daily Step Count—a modest effect. The Predictor Impact Score of 0.00 indicates this relationship is requiring additional data before conclusions.
Bottom Line: Based on a PIS of 0.00 and a 14.1% effect size, this relationship currently lacks sufficient evidence. Continue monitoring as more data becomes available. Note: These conclusions may strengthen or change direction as more data is collected.
These findings contribute to our understanding of how Allegro Tea, Organic Peaceful Slumber Tea may influence Daily Step Count in real-world conditions. While preliminary, these results may inform future research directions. As more participants contribute data, the reliability and precision of these findings will improve substantially.
Help End Unnecessary Suffering
Current clinical trials are 82x more expensive than necessary and take 17 years to bring treatments to market. Pragmatic trials integrated into standard healthcare could reduce costs from $41,000 to $500 per participant and compress timelines to just 2 years. Learn how redirecting just 1% of global military spending could accelerate cures for the 2 billion people suffering from treatable diseases.
Methods
Study Design
This study is based on data donated by 1 participants. Thus, the study design is equivalent to the aggregation of 1 separate n=1 observational natural experiments.
This within-subject design is powerful because it controls for all stable individual characteristics (genetics, baseline health status, socioeconomic factors) that might otherwise confound the relationship between variables.
Data Analysis
Temporal Assumptions
The analysis incorporates temporal assumptions about the relationship between variables:
- Onset Delay: It was assumed that 30 minutes would pass before a change in Allegro Tea, Organic Peaceful Slumber Tea would produce an observable change in Daily Step Count.
- Duration of Action: It was assumed that Allegro Tea, Organic Peaceful Slumber Tea could produce an observable change in Daily Step Count for as much as 24 hours after the stimulus event.
Statistical Methods
For each participant, we calculated the Pearson correlation coefficient between Allegro Tea, Organic Peaceful Slumber Tea values and subsequent Daily Step Count values. Individual correlations were then aggregated using Fisher's z-transformation to produce a population-level estimate:
Individual Correlation:
Fisher's Z-Transformation:
Aggregated Correlation:
Effect Size Calculation
Effect sizes are reported as percent change from baseline. For each participant, we compare the outcome following above-average predictor values to the overall baseline outcome:
Effect Magnitude (Z-Score)
To assess effect magnitude relative to natural variability, we calculate the z-score:
where RSDbaseline is the relative standard deviation of outcome during baseline period
A z-score > 2 indicates statistical significance (p < 0.05), meaning the observed change exceeds typical baseline fluctuation and is unlikely due to random variation.
Statistical Significance
Correlation significance is assessed using a two-tailed t-test:
We reject the null hypothesis (ρ = 0) at α = 0.05 when |t| exceeds the critical value, providing statistical evidence that the observed relationship is not due to chance.
Data Sources
Allegro Tea, Organic Peaceful Slumber Tea data was primarily collected using QuantiModo. QuantiModo allows you to easily track mood, symptoms, or any outcome you want to optimize in a fraction of a second. You can also import your data from over 30 other apps and devices. QuantiModo then analyzes your data to identify which hidden factors are most likely to be influencing your mood or symptoms.
Daily Step Count data was primarily collected using Fitbit. Fitbit makes activity tracking easy and automatic.
Data Quality
Data quality measures were applied to ensure reliable results:
- Minimum Data Requirement: Only participants with sufficient paired observations were included in the analysis.
- Outlier Handling: Extreme values were winsorized to reduce the influence of measurement errors.
- Missing Data: Days with missing values were handled using appropriate filling strategies based on the variable type.
- Test User Exclusion: Test accounts and invalid users were excluded from all analyses.
Principal Investigator
Program & Methods

Cite This Study
@misc{sinn_cause_6059957_effect_1451_population_study_2026,
  author = {Sinn, Mike P.},
  title = {Causal Analysis: Does Allegro Tea, Organic Peaceful Slumber Tea Affect Daily Step Count?},
  year = {2026},
  publisher = {The Journal of Citizen Science},
  url = {https://studies.crowdsourcingcures.org/study/cause-6059957-effect-1451-population-study},
  note = {Accessed: January 6, 2026}
}
Study Type: Aggregated N-of-1 Observational Mega-Study
Evidence Level: Level II (Real-World Evidence)
Methodology: Bradford Hill Criteria with Predictor Impact Score (PIS)
References
This framework was originally developed in 2013 based on the Bradford Hill criteria. Subsequent literature has independently validated similar approaches to causal inference from observational data:
- Hill, A.B. (1965). The environment and disease: association or causation? Proceedings of the Royal Society of Medicine, 58(5), 295-300. [Bradford Hill criteria]
- Lillie, E.O., et al. (2011). The n-of-1 clinical trial: the ultimate strategy for individualizing medicine? Personalized Medicine, 8(2), 161-173. [N-of-1 methodology]
- Pearl, J. (2009). Causality: Models, Reasoning, and Inference . Cambridge University Press. [Causal inference]
- Hernán, M.A., & Robins, J.M. (2020). Causal Inference: What If . Chapman & Hall/CRC. [Free textbook]
- FDA (2018). Framework for FDA's Real-World Evidence Program . U.S. Food and Drug Administration. [Regulatory context]
- Duan, N., et al. (2013). Single-patient (n-of-1) trials: a pragmatic clinical decision methodology . Journal of Clinical Epidemiology, 66(8), S21-S28.
- Platt, R., et al. (2018). The FDA Sentinel Initiative—an evolving national resource . New England Journal of Medicine, 379(22), 2091-2093.
This information is for research and educational purposes only, not medical advice. Consult a healthcare provider before making health decisions. Terms of Service