



Charts
Trait Correlation Between Fat-Free Mass (FFM) or Lean Body Mass (LBM) and Sleep Duration
Fat-Free Mass Charts
Daily Distribution
Average by Day of Week
Average by Month
Average by Year
Sleep Duration Charts
Daily Distribution
Average by Day of Week
Average by Month
Average by Year
Relationship Charts
Sleep Duration Following Fat-Free Mass (FFM) or Lean Body Mass (LBM)
Correlation Between Fat-Free Mass (FFM) or Lean Body Mass (LBM) and Sleep Duration by Duration of Action
Correlation Between Fat-Free Mass (FFM) or Lean Body Mass (LBM) and Sleep Duration by Onset Delay
Average Fat-Free Mass (FFM) or Lean Body Mass (LBM) Preceding Sleep Duration
Average Sleep Duration by Previous Fat-Free Mass (FFM) or Lean Body Mass (LBM)

Abstract
Sleep Duration was generally 34% higher than average after an average of 59.1 kilograms of Fat-Free Mass over the previous 7 days.
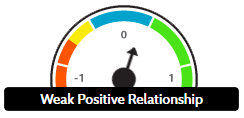
Aggregated data from 16 study participants suggests with a HIGH degree of confidence (p=0.165, 95% CI -0.737 to 1.062) that Fat-Free Mass has a weakly positive predictive relationship (R=0.163) with Sleep Duration.
The highest quartile of Sleep Duration measurements were observed following an average 62.1 kilograms Fat-Free Mass.
The lowest quartile of Sleep Duration measurements were observed following an average 61.6 kilograms of Fat-Free Mass.
After an onset delay of 0 seconds, Sleep Duration is typically 19% lower than average over the 7 days following around 61.6 kilograms Fat-Free Mass.

Objective

Participant Instructions
 Automatic Import of Fat-Free Mass (FFM) or Lean Body Mass (LBM) via Fitbit
 Get Fitbit here
and use it to record your Fat-Free Mass (FFM) or Lean Body Mass (LBM). Then,
Get Fitbit here
and use it to record your Fat-Free Mass (FFM) or Lean Body Mass (LBM). Then,
 import your data here
.
import your data here
.
Manual Recording Option
 Create a reminder for Fat-Free Mass (FFM) or Lean Body Mass (LBM) here
and record it daily by enabling notifications or using
Create a reminder for Fat-Free Mass (FFM) or Lean Body Mass (LBM) here
and record it daily by enabling notifications or using
 the reminder inbox here
.
the reminder inbox here
.
Automatic Import of Fat-Free Mass (FFM) or Lean Body Mass (LBM) via Withings
 Get Withings here
and use it to record your Fat-Free Mass (FFM) or Lean Body Mass (LBM). Then,
import your data here
.
Get Withings here
and use it to record your Fat-Free Mass (FFM) or Lean Body Mass (LBM). Then,
import your data here
.
 Automatic Import of Sleep Duration via Fitbit
Get Fitbit here
and use it to record your Sleep Duration. Then,
import your data here
.
Manual Recording Option
 Create a reminder for Sleep Duration here
and record it daily by enabling notifications or using
the reminder inbox here
.
Create a reminder for Sleep Duration here
and record it daily by enabling notifications or using
the reminder inbox here
.

Design
This study is based on data donated by 16 participants. Thus, the study design is equivalent to the aggregation of 16 separate n=1 observational natural experiments.
Data Analysis
Fat-Free Mass (FFM) or Lean Body Mass (LBM) Pre-Processing
Fat-Free Mass (FFM) or Lean Body Mass (LBM) measurement values below 0 kilograms were assumed erroneous and removed. No maximum allowed measurement value was defined for Fat-Free Mass (FFM) or Lean Body Mass (LBM). No missing data filling value was defined for Fat-Free Mass (FFM) or Lean Body Mass (LBM) so any gaps in data were just not analyzed instead of assuming zero values for those times.
Sleep Duration Pre-Processing
Sleep Duration measurement values below 6 minutes were assumed erroneous and removed. Sleep Duration measurement values above 16 hours were assumed erroneous and removed. No missing data filling value was defined for Sleep Duration so any gaps in data were just not analyzed instead of assuming zero values for those times.
Predictive Analytics
It was assumed that 0 seconds would pass before a change in Fat-Free Mass (FFM) Or Lean Body Mass (LBM) would produce an observable change in Sleep Duration.
It was assumed that Fat-Free Mass (FFM) Or Lean Body Mass (LBM) could produce an observable change in Sleep Duration for as much as 7 days after the stimulus event.

Statistical Significance
Using a two-tailed t-test with alpha = 0.05, it was determined that the change in Sleep Duration is statistically significant at 95% confidence interval.
After treatment, a 13.5% increase (25 minutes) from the mean baseline 3 hours was observed. The relative standard deviation at baseline was 118.213%. The observed change was 0.422665 times the standard deviation.
A common rule of thumb considers a change greater than twice the baseline standard deviation on two separate pre-post experiments may be considered significant. This occurrence would have only a 5% likelihood of resulting from random fluctuation (a p-value < 0.05).


Limitations
As with any human experiment, it was impossible to control for all potentially confounding variables. Correlation does not necessarily imply causation. We can never know for sure if one factor is definitely the cause of an outcome. However, lack of correlation definitely implies the lack of a causal relationship. Hence, we can with great confidence rule out non-existent relationships. For instance, if we discover no relationship between mood and an antidepressant this information is just as or even more valuable than the discovery that there is a relationship.
We can also take advantage of several characteristics of time series data from many subjects to infer the likelihood of a causal relationship if we do find a correlational relationship. The criteria for causation are a group of minimal conditions necessary to provide adequate evidence of a causal relationship between an incidence and a possible consequence.
Criteria For Causal Inference
Strength (A.K.A. Effect Size)
A small association does not mean that there is not a causal effect, though the larger the association, the more likely that it is causal. There is a weakly positive (R = 0.1629) relationship between Fat-Free Mass (FFM) Or Lean Body Mass (LBM) and Sleep Duration.
Consistency (A.K.A. Reproducibility)
Consistent findings observed by different persons in different places with different samples strengthens the likelihood of an effect. Furthermore, in accordance with the law of large numbers (LLN), the predictive power and accuracy of these results will continually grow over time. 3193 paired data points were used in this analysis. Assuming that the relationship is merely coincidental, as the participant independently modifies their Fat-Free Mass (FFM) Or Lean Body Mass (LBM) values, the observed strength of the relationship will decline until it is below the threshold of significance. To it another way, in the case that we do find a spurious correlation, suggesting that banana intake improves mood for instance, one will likely increase their banana intake. Due to the fact that this correlation is spurious, it is unlikely that you will see a continued and persistent corresponding increase in mood. So over time, the spurious correlation will naturally dissipate.
Specificity
Causation is likely if a very specific population at a specific site and disease with no other likely explanation. The more specific an association between a factor and an effect is, the bigger the probability of a causal relationship.
Temporality
The effect has to occur after the cause (and if there is an expected delay between the cause and expected effect, then the effect must occur after that delay). The confidence in a causal relationship is bolstered by the fact that time-precedence was taken into account in all calculations.
Biological Gradient
Greater exposure should generally lead to greater incidence of the effect. However, in some cases, the mere presence of the factor can trigger the effect. In other cases, an inverse proportion is observed: greater exposure leads to lower incidence.
Plausibility
A plausible bio-chemical mechanism between cause and effect is critical. This is where human brains excel.
Based on our responses so far,
0 humans feel that there is a plausible mechanism of action for a relationship between Fat-Free Mass (FFM) Or Lean Body Mass (LBM) and Sleep Duration.
0 humans feel that any relationship observed between Fat-Free Mass (FFM) Or Lean Body Mass (LBM) and Sleep Duration is coincidental.
Coherence
Coherence between epidemiological and laboratory findings increases the likelihood of an effect. It will be very enlightening to aggregate this data with the data from other participants with similar genetic, diseasomic, environmentomic, and demographic profiles.
Experiment
All of human life can be considered a natural experiment. Occasionally, it is possible to appeal to experimental evidence.
Analogy
The effect of similar factors may be considered.
Plausibility
A plausible bio-chemical mechanism between cause and effect is critical. This is where human brains excel. Based on our responses so far, 0 humans feel that there is a plausible mechanism of action and 0 feel that any relationship observed between Fat-Free Mass (FFM) Or Lean Body Mass (LBM) and Sleep Duration is coincidental.
Relationship Statistics
| Property | Value |
|---|---|
| Cause Variable Name | Fat-Free Mass (FFM) Or Lean Body Mass (LBM) |
| Effect Variable Name | Sleep Duration |
| Sinn Predictive Coefficient | 0.065005528932816 |
| Confidence Level | HIGH |
| Confidence Interval | 0.89946945466628 |
| Forward Pearson Predictive Coefficient | 0.1629 |
| Critical T Value | 1.6829375 |
| Average Fat- Free Mass (FFM) Or Lean Body Mass (LBM) Over Previous 7 days Before ABOVE Average Sleep Duration | 62.1 kilograms |
| Average Fat- Free Mass (FFM) Or Lean Body Mass (LBM) Over Previous 7 days Before BELOW Average Sleep Duration | 61.6 kilograms |
| Duration of Action | 7 days |
| Effect Size | weakly positive |
| Number of Paired Measurements | 3193 |
| Optimal Pearson Product | 0.095738807699694 |
| P Value | 0.16494924430376 |
| Statistical Significance | 0.6474 |
| Strength of Relationship | 0.89946945466628 |
| Study Type | population |
| Analysis Performed At | 2021-08-30 |
| Number of Participants | 16 |
Fat-Free Mass (FFM) or Lean Body Mass (LBM) Info
| Property | Value |
|---|---|
| Variable Name | Fat-Free Mass (FFM) Or Lean Body Mass (LBM) |
| Aggregation Method | MEAN |
| Analysis Performed At | 2020-10-11 |
| Duration of Action | 7 days |
| Kurtosis | 10.976892166151 |
| Mean | 64.252128806083 kilograms |
| Median | 64.157985294118 kilograms |
| Minimum Allowed Value | 0 kilograms |
| Number of Aggregate Predictors | 1182 |
| Number of Aggregate Outcomes | 143 |
| Number of Measurements | 16653 |
| Number of Measurements (including those generated by tagged, joined, or child variables) | 11124 |
| Public | true |
| Onset Delay | 0 seconds |
| Standard Deviation | 3.7685853910783 |
| Unit | Kilograms |
| User Variables | 35 |
| UPC | 767674467897 |
| Variable Category | Physique |
| Variable ID | 5955691 |
| Variance | 43.756405212264 |
Sleep Duration Info
| Property | Value |
|---|---|
| Variable Name | Sleep Duration |
| Aggregation Method | MEAN |
| Analysis Performed At | 2020-10-11 |
| Duration of Action | 7 days |
| Kurtosis | 3.1431132810239 |
| Maximum Allowed Value | 16 hours |
| Mean | 7 hours |
| Median | 7 hours |
| Minimum Allowed Value | 6 minutes |
| Number of Aggregate Predictors | 3162 |
| Number of Aggregate Outcomes | 217 |
| Number of Measurements | 43055 |
| Number of Measurements (including those generated by tagged, joined, or child variables) | 16052 |
| Public | true |
| Onset Delay | 0 seconds |
| Standard Deviation | 1.2204190250991 |
| Unit | Hours |
| User Variables | 404 |
| UPC | 067981966602 |
| Variable Category | Sleep |
| Variable ID | 1867 |
| Variance | 2.1855287054824 |